Centerville, Leon County, Texas
History
Centerville became the county seat of Leon County in 1850. It was originally built on 200 acres donated by Robert J Townes and D.C. Carrington.
The town established an annual Black-Eyed Pea Festival in 1937.
-
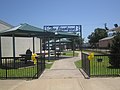 "The Courtyard" across from the Leon County Courthouse in Centerville
 -
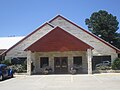 Citizens State Bank in Centerville
 -
 Pix Theater opened in 1941. It is now closed
 -
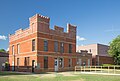
 Leon County Courthouse was built in 1887
 -
 Leon County Jail is located in Centerville, Texas


.jpg)
.jpg)
.jpg)
Geography
According to the United States Census Bureau, Centerville has a total area of 1.5 square miles (3.9 km), all land.
Climate
The climate in this area is characterized by hot, humid summers and generally mild to cool winters. According to the Köppen climate classification, Centerville has a humid subtropical climate, Cfa on climate maps. The hottest temperature recorded in Centerville was 111 °F (43.9 °C) on August 12, 1948 and July 26, 1954, while the coldest temperature recorded was 0 °F (−17.8 °C) on February 1, 1951.
| Climate data for Centerville, Texas, 1991–2020 normals, extremes 1937–present | |||||||||||||
|---|---|---|---|---|---|---|---|---|---|---|---|---|---|
| Month | Jan | Feb | Mar | Apr | May | Jun | Jul | Aug | Sep | Oct | Nov | Dec | Year |
| Record high °F (°C) | 89 (32) |
94 (34) |
98 (37) |
99 (37) |
98 (37) |
106 (41) |
111 (44) |
111 (44) |
110 (43) |
97 (36) |
96 (36) |
87 (31) |
111 (44) |
| Mean maximum °F (°C) | 76.6 (24.8) |
80.0 (26.7) |
84.6 (29.2) |
88.2 (31.2) |
92.2 (33.4) |
96.5 (35.8) |
99.6 (37.6) |
100.7 (38.2) |
97.8 (36.6) |
91.3 (32.9) |
83.7 (28.7) |
78.2 (25.7) |
101.8 (38.8) |
| Mean daily maximum °F (°C) | 59.5 (15.3) |
63.4 (17.4) |
70.3 (21.3) |
77.5 (25.3) |
84.1 (28.9) |
90.5 (32.5) |
94.0 (34.4) |
94.9 (34.9) |
89.1 (31.7) |
80.1 (26.7) |
69.2 (20.7) |
60.7 (15.9) |
77.8 (25.4) |
| Daily mean °F (°C) | 47.3 (8.5) |
51.1 (10.6) |
57.7 (14.3) |
65.0 (18.3) |
72.9 (22.7) |
79.8 (26.6) |
82.8 (28.2) |
83.0 (28.3) |
76.9 (24.9) |
66.8 (19.3) |
56.6 (13.7) |
48.8 (9.3) |
65.7 (18.7) |
| Mean daily minimum °F (°C) | 35.1 (1.7) |
38.9 (3.8) |
45.2 (7.3) |
52.4 (11.3) |
61.7 (16.5) |
69.1 (20.6) |
71.7 (22.1) |
71.0 (21.7) |
64.8 (18.2) |
53.5 (11.9) |
44.0 (6.7) |
36.9 (2.7) |
53.7 (12.0) |
| Mean minimum °F (°C) | 19.8 (−6.8) |
24.3 (−4.3) |
27.1 (−2.7) |
35.9 (2.2) |
45.9 (7.7) |
60.2 (15.7) |
65.2 (18.4) |
63.8 (17.7) |
51.1 (10.6) |
37.2 (2.9) |
27.0 (−2.8) |
22.9 (−5.1) |
17.9 (−7.8) |
| Record low °F (°C) | 5 (−15) |
0 (−18) |
15 (−9) |
26 (−3) |
36 (2) |
48 (9) |
52 (11) |
52 (11) |
39 (4) |
27 (−3) |
15 (−9) |
1 (−17) |
0 (−18) |
| Average precipitation inches (mm) | 3.47 (88) |
3.22 (82) |
3.90 (99) |
3.11 (79) |
4.65 (118) |
4.00 (102) |
2.47 (63) |
2.71 (69) |
3.22 (82) |
4.22 (107) |
3.63 (92) |
3.81 (97) |
42.41 (1,078) |
| Average snowfall inches (cm) | 0.0 (0.0) |
0.1 (0.25) |
0.0 (0.0) |
0.0 (0.0) |
0.0 (0.0) |
0.0 (0.0) |
0.0 (0.0) |
0.0 (0.0) |
0.0 (0.0) |
0.0 (0.0) |
0.0 (0.0) |
0.0 (0.0) |
0.1 (0.25) |
| Average precipitation days (≥ 0.01 in) | 7.0 | 7.6 | 7.1 | 5.6 | 6.6 | 6.8 | 4.7 | 5.3 | 6.1 | 6.0 | 6.9 | 7.9 | 77.6 |
| Average snowy days (≥ 0.1 in) | 0.0 | 0.1 | 0.0 | 0.0 | 0.0 | 0.0 | 0.0 | 0.0 | 0.0 | 0.0 | 0.0 | 0.0 | 0.1 |
| Source 1: NOAA | |||||||||||||
| Source 2: National Weather Service | |||||||||||||
Demographics
| Census | Pop. | Note | %± |
|---|---|---|---|
| 1870 | 221 | — | |
| 1880 | 225 | 1.8% | |
| 1890 | 288 | 28.0% | |
| 1930 | 388 | — | |
| 1940 | 900 | 132.0% | |
| 1950 | 961 | 6.8% | |
| 1960 | 836 | −13.0% | |
| 1970 | 831 | −0.6% | |
| 1980 | 799 | −3.9% | |
| 1990 | 812 | 1.6% | |
| 2000 | 903 | 11.2% | |
| 2010 | 892 | −1.2% | |
| 2020 | 905 | 1.5% | |
| U.S. Decennial Census | |||
| Race | Number | Percentage |
|---|---|---|
| White (NH) | 677 | 74.81% |
| Black or African American (NH) | 133 | 14.7% |
| Asian (NH) | 9 | 0.99% |
| Some Other Race (NH) | 2 | 0.22% |
| Mixed/Multi-Racial (NH) | 15 | 1.66% |
| Hispanic or Latino | 69 | 7.62% |
| Total | 905 |
As of the 2020 United States census, there were 905 people, 371 households, and 239 families residing in the city.
At the 2000 census, 903 people, 388 households, and 230 families were living in the city. The population density was 620.9 inhabitants per square mile (239.7/km). The 464 housing units had an average density of 319.0/sq mi (123.6/km). The racial makeup of the city was 75.30% White, 21.82% African American, 0.33% Native American, 0.22% Asian, 1.66% from other races, and 0.66% from two or more races. Hispanics or Latinos of any race were 1.99%.
Of the 388 households, 25.3% had children under 18 living with them, 46.4% were married couples living together, 10.3% had a female householder with no husband present, and 40.5% were not families. About 38.1% of households were one person, and 22.9% were one person aged 65 or older. The average household size was 2.17, and the average family size was 2.89.
The age distribution was 22.1% under 18, 6.3% from 18 to 24, 22.6% from 25 to 44, 25.0% from 45 to 64, and 23.9% 65 or older. The median age was 44 years. For every 100 females, there were 83.9 males. For every 100 females age 18 and over, there were 77.5 males.
The median income for a household was $25,677 and for a family was $35,278. Males had a median income of $38,125 versus $19,167 for females. The per capita income for the city was $15,469. About 14.9% of families and 19.1% of the population were below the poverty line, including 19.7% of those under age 18 and 20.9% of those age 65 or over.
Education
The City of Centerville is served by the Centerville Independent School District.
Notable people
- Marva Black Beck, former Texas House Representative
- Lightnin' Hopkins, blues singer; born in Centerville in 1912
- Mike McKinney, former mayor, Texas House Representative, and the 13th chancellor of the Texas A&M University System