File:2017 Global Warming Attribution - Based On NCA4 Fig 3.3 - Single-panel Version.svg
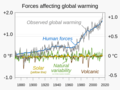
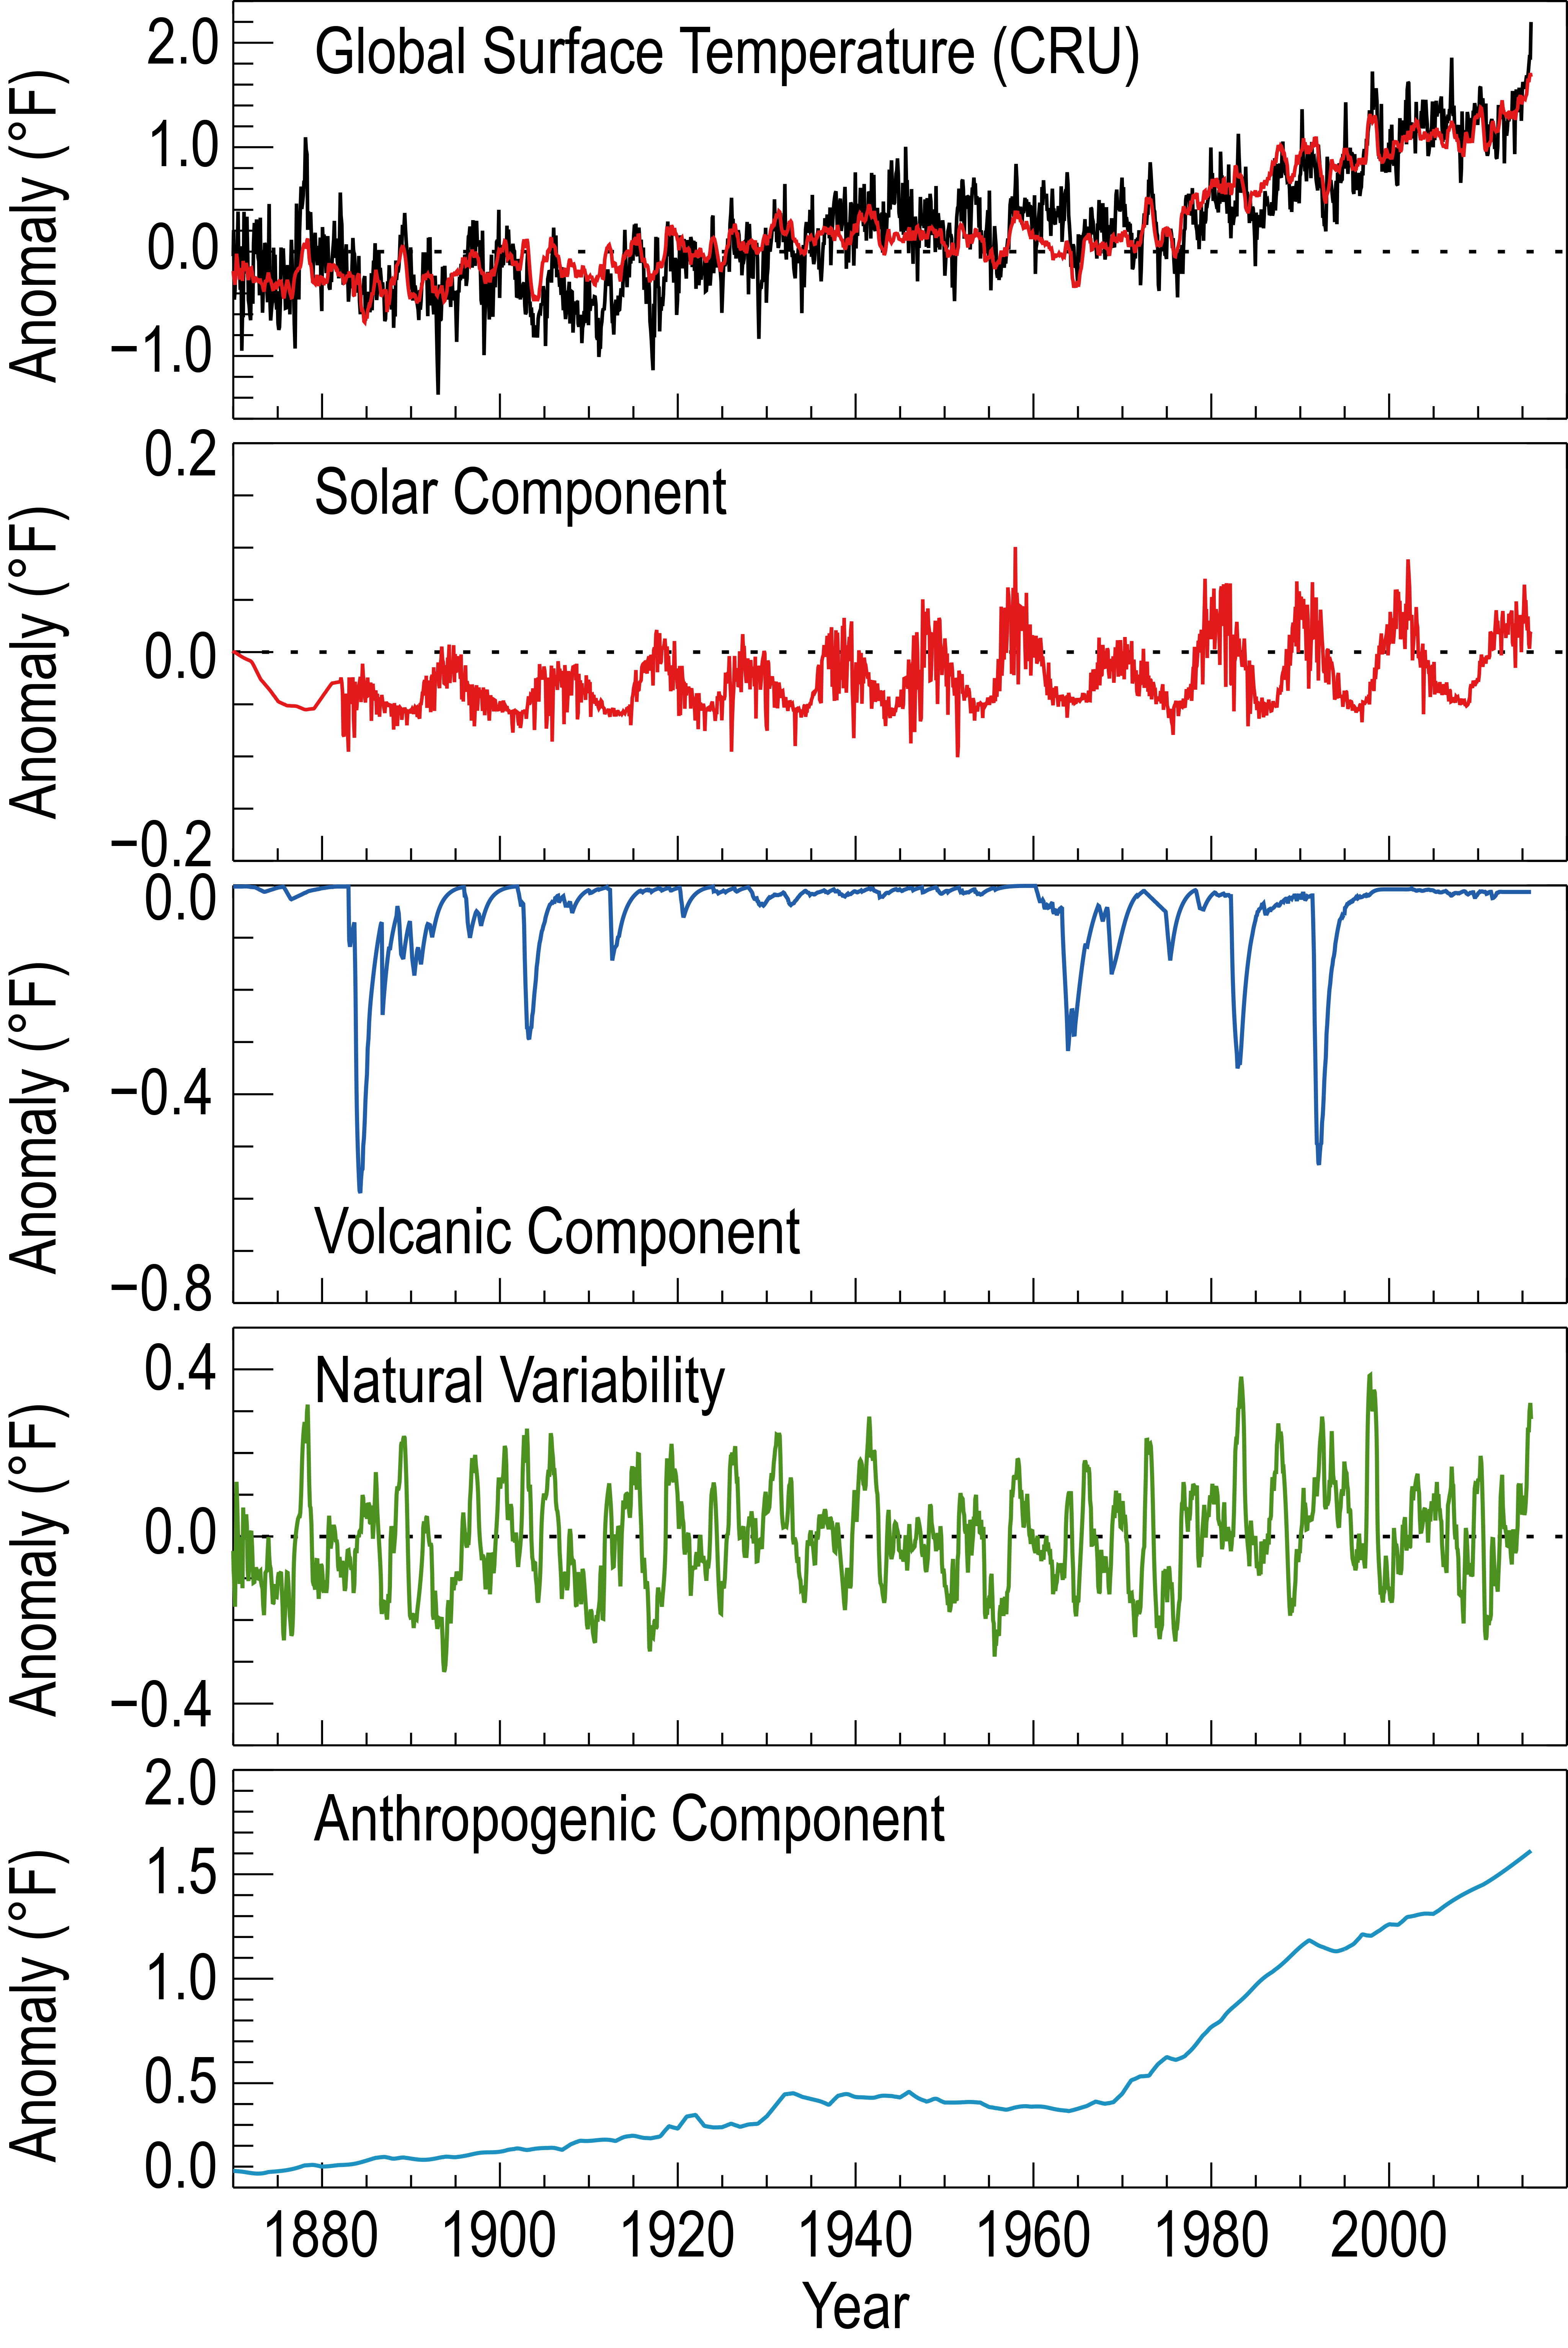
Uploader took separate charts, changed them in Photoshop to a common vertical (temperature anomaly) scale, and merged them into this composite graphic.
Source of charts from which the above composite chart was formed:
- Climate Science Special Report: Fourth National Climate Assessment, Volume I - Chapter 3: Detection and Attribution of Climate Change. science2017.globalchange.gov. U.S. Global Change Research Program (USGCRP) (2017). Archived from the original on September 23, 2019. Adapted directly from Fig. 3.3.
-
 PNG predecessor (Feb 2020)
 -
 Two-panel PNG version (Oct 2019)


