File:ELLIPTICAL GENETIC CODE Ian.png
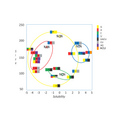
The strongest components (bias) for the encoding of amino acid residues are, in order:
C in 2nd position = small size, medium hydropathy
U in 2nd position = average size, hydrophobic
A in 2nd position = average size, hydrophilic
U in 1st position = not hydrophilic
The y-axis is accurate (cubic Ångströms (ų)), but the x-axis could have some error from estimates of hydropathy.
Redrawn from Figure 4 in Genetic Algorithms and Recursive Ensemble Mutagenesis in Protein Engineering, which attributes the graph to Yang, M. M., W. J. Coleman and D. C. Youvan. 1990. In Reaction Centers of Photosynthetic Bacteria. M.-E. Michel-Beyerle. (Ed.) (Springer-Verlag, Germany) p209-218; listed by Google at [1]Licensing
- You are free:
- to share – to copy, distribute and transmit the work
- to remix – to adapt the work
- Under the following conditions:
- attribution – You must give appropriate credit, provide a link to the license, and indicate if changes were made. You may do so in any reasonable manner, but not in any way that suggests the licensor endorses you or your use.
- share alike – If you remix, transform, or build upon the material, you must distribute your contributions under the same or compatible license as the original.
Derived from https://commons.wikimedia.org/key/File:Hydropathy_Molar_Volume_Genetic_Code_2.png A codon position is biased if the elliptical trace is: 1) not centered on the center of the (square) graph frame, and / or 2) contains a smaller-than-random volume. First position - dashed. Second position - solid. The strongest components (bias) for the encoding of anino acid residues are, in order: C in 2nd position = small size, medium hydropathy U in 2nd position = average size, hydrophobic A in 2nd position = average size, hydrophilic U in 1st position = not hydrophilic The y-axis is accurate (cubic Angstroms), but the x-axis could have some error from estimates of hydropathy. Redrawn from Figure 4 in http://www.complexity.org.au/ci/vol01/fullen01/html/ archive copy at the Wayback Machine which attributes the graph to Yang, M. M., W. J. Coleman and D. C. Youvan. 1990. In Reaction Centers of Photosynthetic Bacteria. M.-E. Michel-Beyerle. (Ed.) (Springer-Verlag, Germany) p209-218; listed by Google at [1] Date 30 May 2008 Source doug youvan Author Doug Youvan


