File:European Output Of Printed Books Ca. 1450–1800.png
Tentotwo
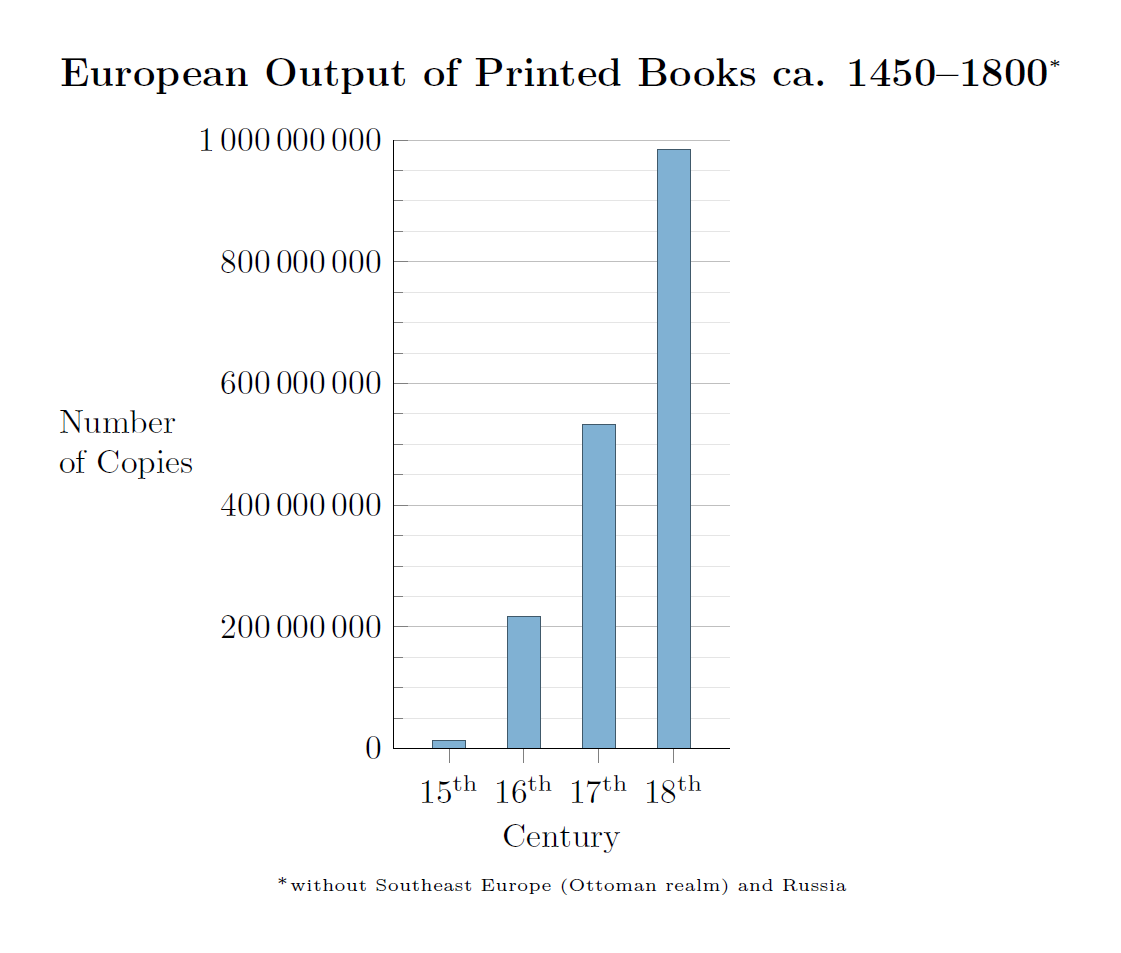
Data from: Buringh, Eltjo; van Zanden, Jan Luiten: "Charting the “Rise of the West”: Manuscripts and Printed Books in Europe, A Long-Term Perspective from the Sixth through Eighteenth Centuries", The Journal of Economic History, Vol. 69, No. 2 (2009), pp. 409–445 (417, table 2)
Other versions
Data from: Buringh, Eltjo; van Zanden, Jan Luiten: "Charting the “Rise of the West”: Manuscripts and Printed Books in Europe, A Long-Term Perspective from the Sixth through Eighteenth Centuries", The Journal of Economic History, Vol. 69, No. 2 (2009), pp. 409–445 (417, table 2)
-
 German version
 -
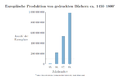
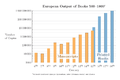 European output of manuscripts and printed books 500–1800


|
File:European Output of Printed Books ca. 1450–1800.svg is a vector version of this file. It should be used in place of this PNG file when not inferior.
File:European Output of Printed Books ca. 1450–1800.png → File:European Output of Printed Books ca. 1450–1800.svg
For more information, see Help:SVG. |
 |
LaTeX source
\documentclass[border=5mm]{standalone}
\usepackage{pgfplots}
\usepackage[super]{nth}
\usepackage{amsmath}
\pgfplotstableread{
Century Manuscripts Books
6       13552           nan
7       10639           nan
8       43702           nan
9       201742  nan
10      135637  nan
11      212030  nan
12      768721  nan
13      1761951 nan
14      2746951 nan
15      4999161 12589000
16       nan            217444000
17      nan             531941000
18      nan             983874000
}\datatable

\definecolor{RYB1}{RGB}{128, 177, 211}

\begin{document}
\begin{tikzpicture}
  \begin{axis}[
        x=0.7895cm,
        axis on top=false, grid=both, xmajorgrids=false, xminorgrids=false, every minor grid/.style=gray!20,
        minor y tick num=3,
        axis lines*=left,
        width=12cm, height=8cm, enlarge x limits=0.25,
        ymin=0, ymax=1e9, scaled y ticks=false,
        yticklabel={\pgfmathprintnumber[fixed, set thousands separator=\,]{\tick}},
        enlarge y limits=false,
        ybar=-10pt, xtick={15,...,19}, xticklabel={\pgfmathparse{int(\tick)}\nth{\pgfmathresult}},
        xlabel=Century, xlabel style={yshift=-1ex},ylabel=Number\\ of Copies,
         ylabel style={rotate=-90, align=left, anchor=east, xshift=-5ex, name=ylabel},
        title={European Output of Printed Books ca. 1450--1800$^{\text{\tiny{*}}}$},
        title style={font=\large\bfseries, align=center,yshift=1ex}
        ]

\addplot +[fill=RYB1, draw=RYB1!50!black] table [y=Books] {\datatable};
\draw (rel axis cs:0,0) -- (rel axis cs:1,0);
  \end{axis}
\node at (current axis.below south) [anchor=north, align=left, font=\tiny] {$^*$without Southeast Europe (Ottoman realm) and Russia};

\end{tikzpicture}
\end{document}
Licensing
I, the copyright holder of this work, hereby publish it under the following license:
This file is licensed under the Creative Commons Attribution-Share Alike 3.0 Unported license.
- You are free:
- to share – to copy, distribute and transmit the work
- to remix – to adapt the work
- Under the following conditions:
- attribution – You must give appropriate credit, provide a link to the license, and indicate if changes were made. You may do so in any reasonable manner, but not in any way that suggests the licensor endorses you or your use.
- share alike – If you remix, transform, or build upon the material, you must distribute your contributions under the same or compatible license as the original.

