File:GW170814 Signal.png
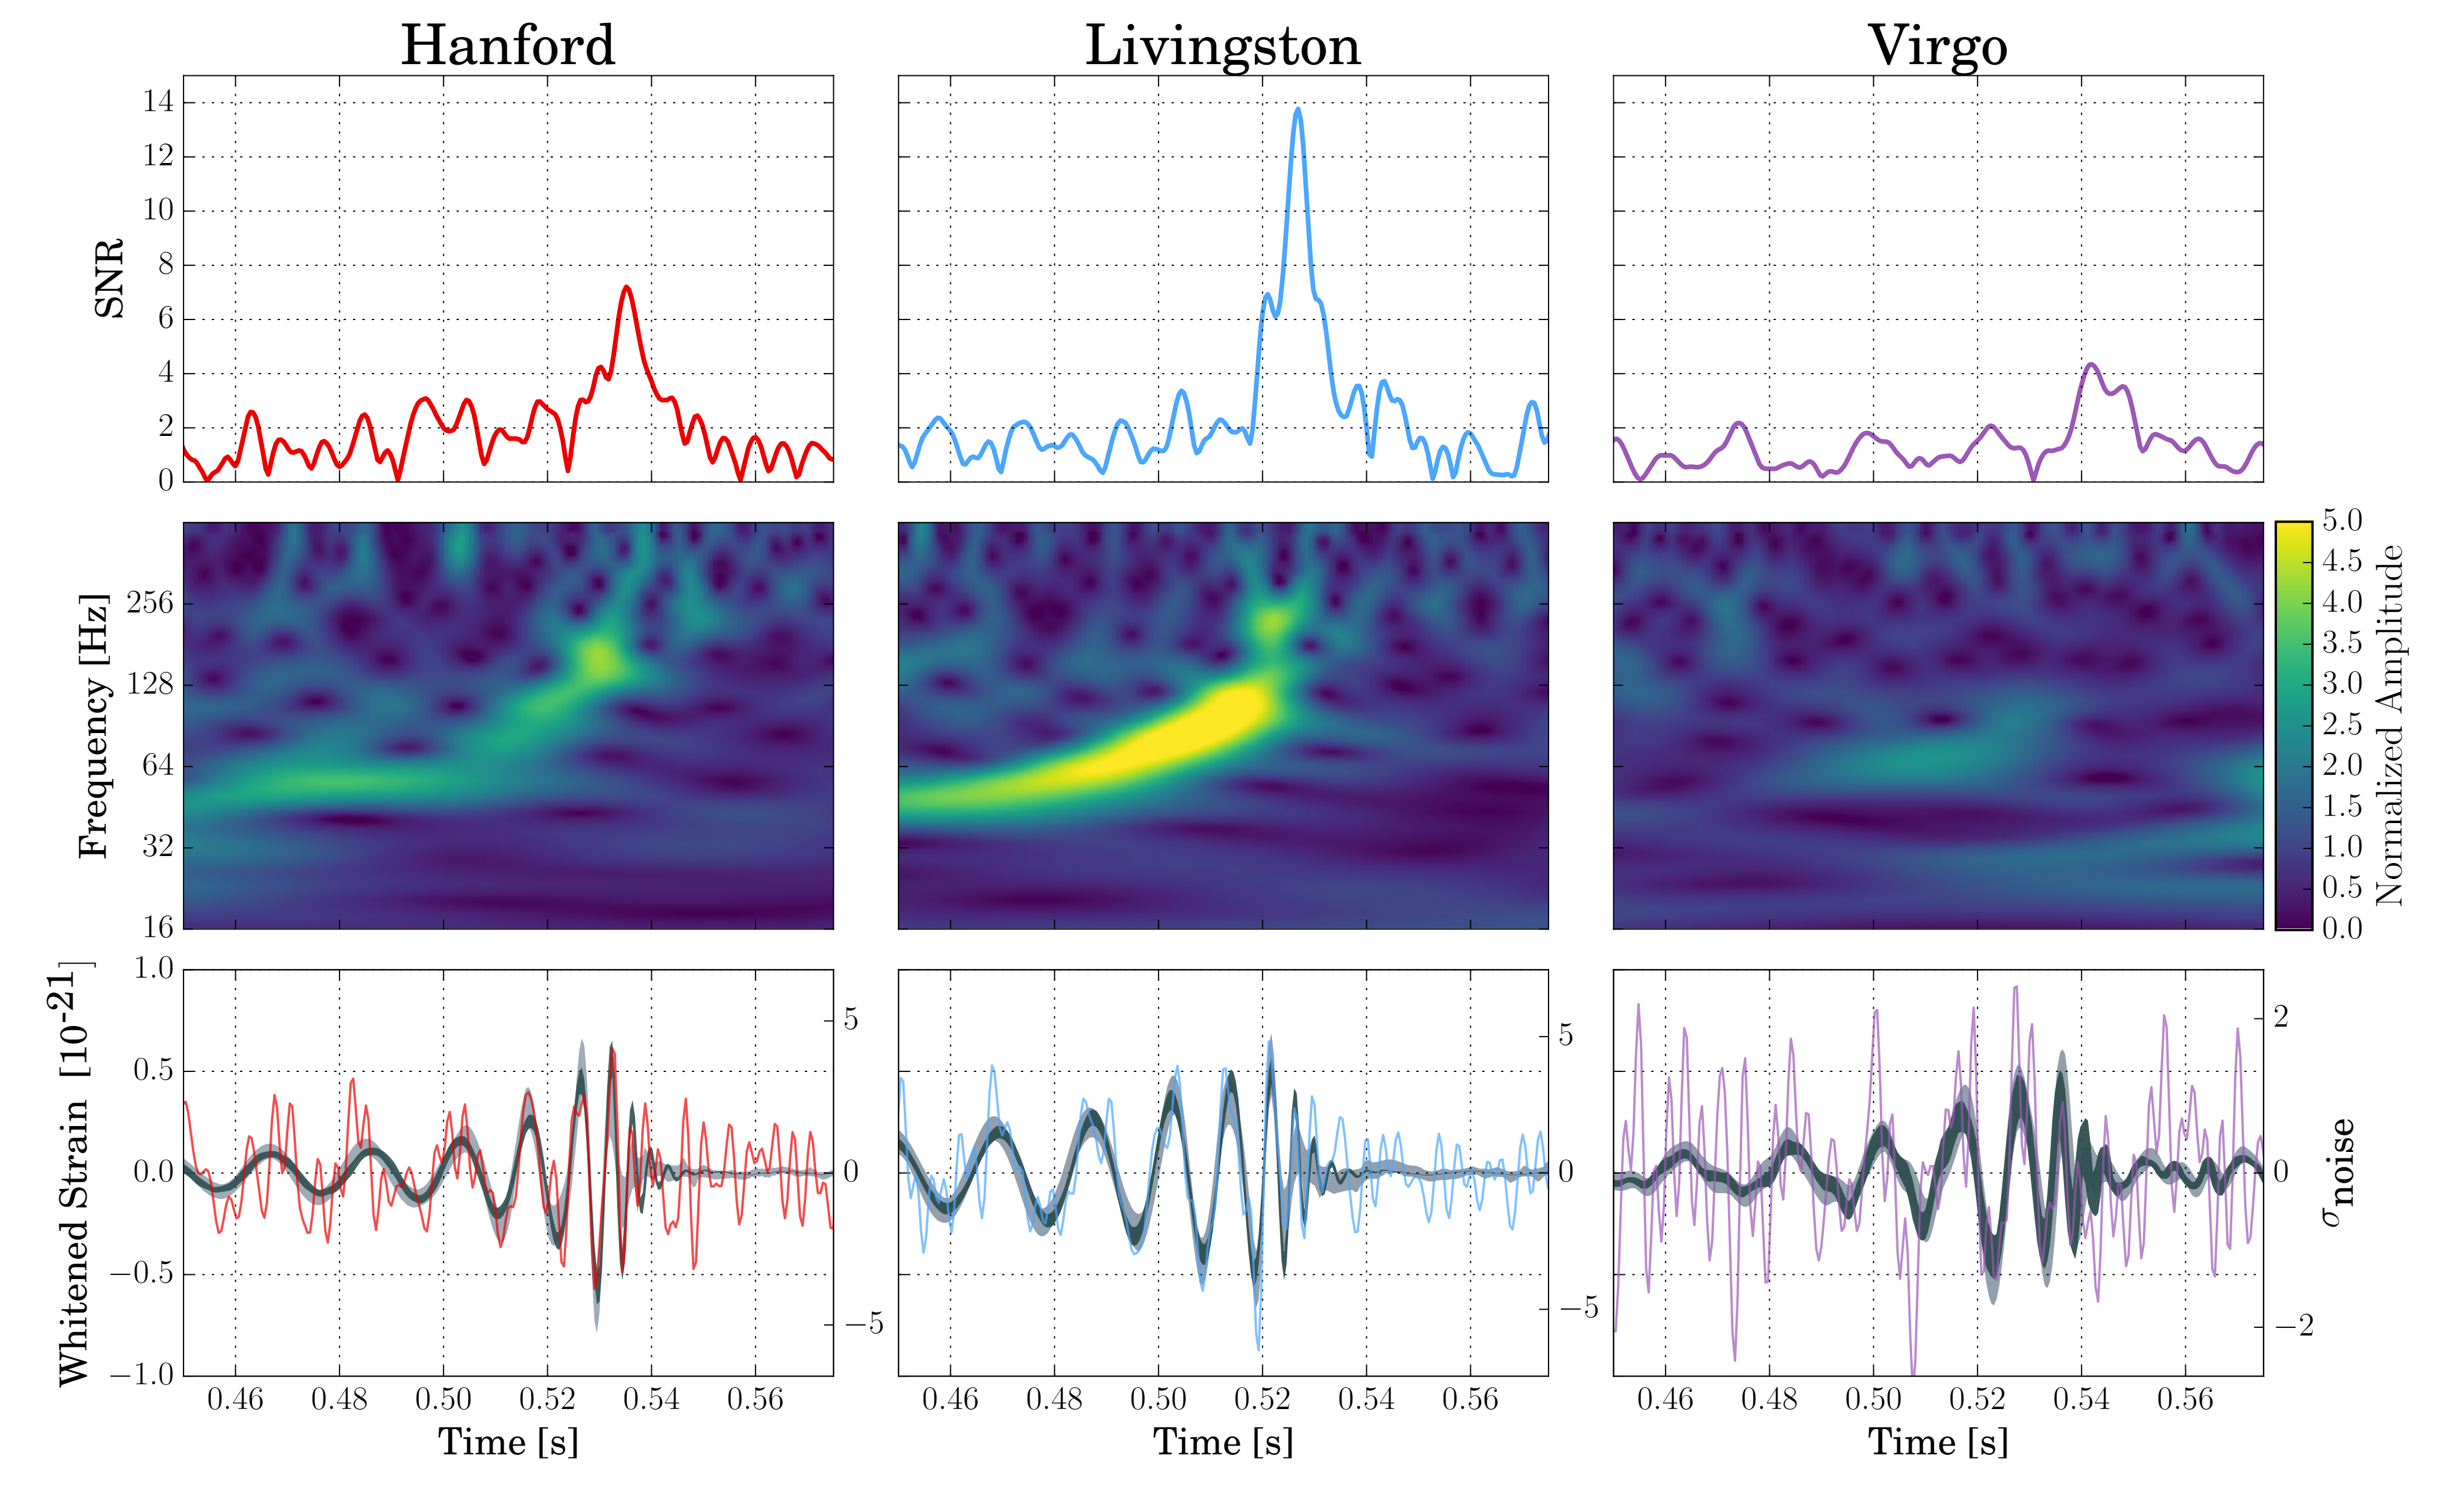
Middle row: Time-frequency representation of the strain data. The brighter a given pixel in any of the three 2D-maps, the larger the signal at this particular time and frequency with respect to the expected noise level. Note the characteristic "chirp" pattern of increasing frequency with time.
Bottom row: Strain time series with the best waveforms selected by the matched filtering (black solid curves) and unmodeled search methods (gray bands) superimposed.
This plot was created with Matplotlib.