File:HyperbolicAnimation.gif
for red points,(1,tan∅)have the unlimited Y value; while (1,tanh∅)'s maximal y vlue is 1.That's what you see in this animated graph.
Click on a date/time to view the file as it appeared at that time.
| Date/Time | Thumbnail | Dimensions | User | Comment | |
|---|---|---|---|---|---|
| current | 16:22, 2 May 2008 | 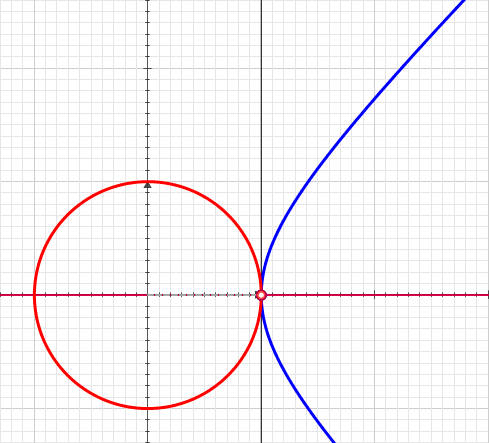 | 489 × 443 (1.09 MB) | File Upload Bot (Magnus Manske) | {{BotMoveToCommons|en.wikipedia}} {{Information |Description={{en|Animated plot of the trigonometric (circular) and hyperbolic functions. In red, curve of equation x² + y² = 1 (unit circle), and in blue, x² - y² = 1 (equilateral hyperbola), w |
The following other wikis use this file: