File:Phase-diag2.svg
Derivative works of this file: Phase-diag2-lv.svg
[]
-
 English
 -
 Deutsch
 -
 Nederlands
 -
 íslenska
 -
 norsk
norsk -
 magyar
 -
 euskara
 -
 русский
 -
 italiano
 -
 polski
 -
 Bahasa Indonesia
 -
 한국어
한국어 -
 中文
中文 -
 日本語
日本語 -
 العربية


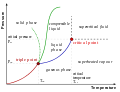
With a more realistic melting curve for ice:
-
 English
 -
 বাংলা
বাংলা -
 čeština
 -
 polski
 -
 македонски
 -
 latviešu
 -
 հայերեն
 -
 italiano
 -
 português
 -
 日本語
日本語 -
 Tiếng Việt


Original upload log
Transferred from en.wikipedia to Commons by Sfan00_IMG using CommonsHelper.
The original description page was here. All following user names refer to en.wikipedia.
- 2008-01-28 10:46 Matthieumarechal 575×443×??? (16659 bytes) {{Information |Description=English: some additions from Image:Phase diagram.svg: Adjusted water solid-liquid coexistence |Source=SVG converstion from raster image Image:Phase-diag.png; some additions from Image:Phase diagram.png |Date= |Location= |Author=


