File:Pwm.png
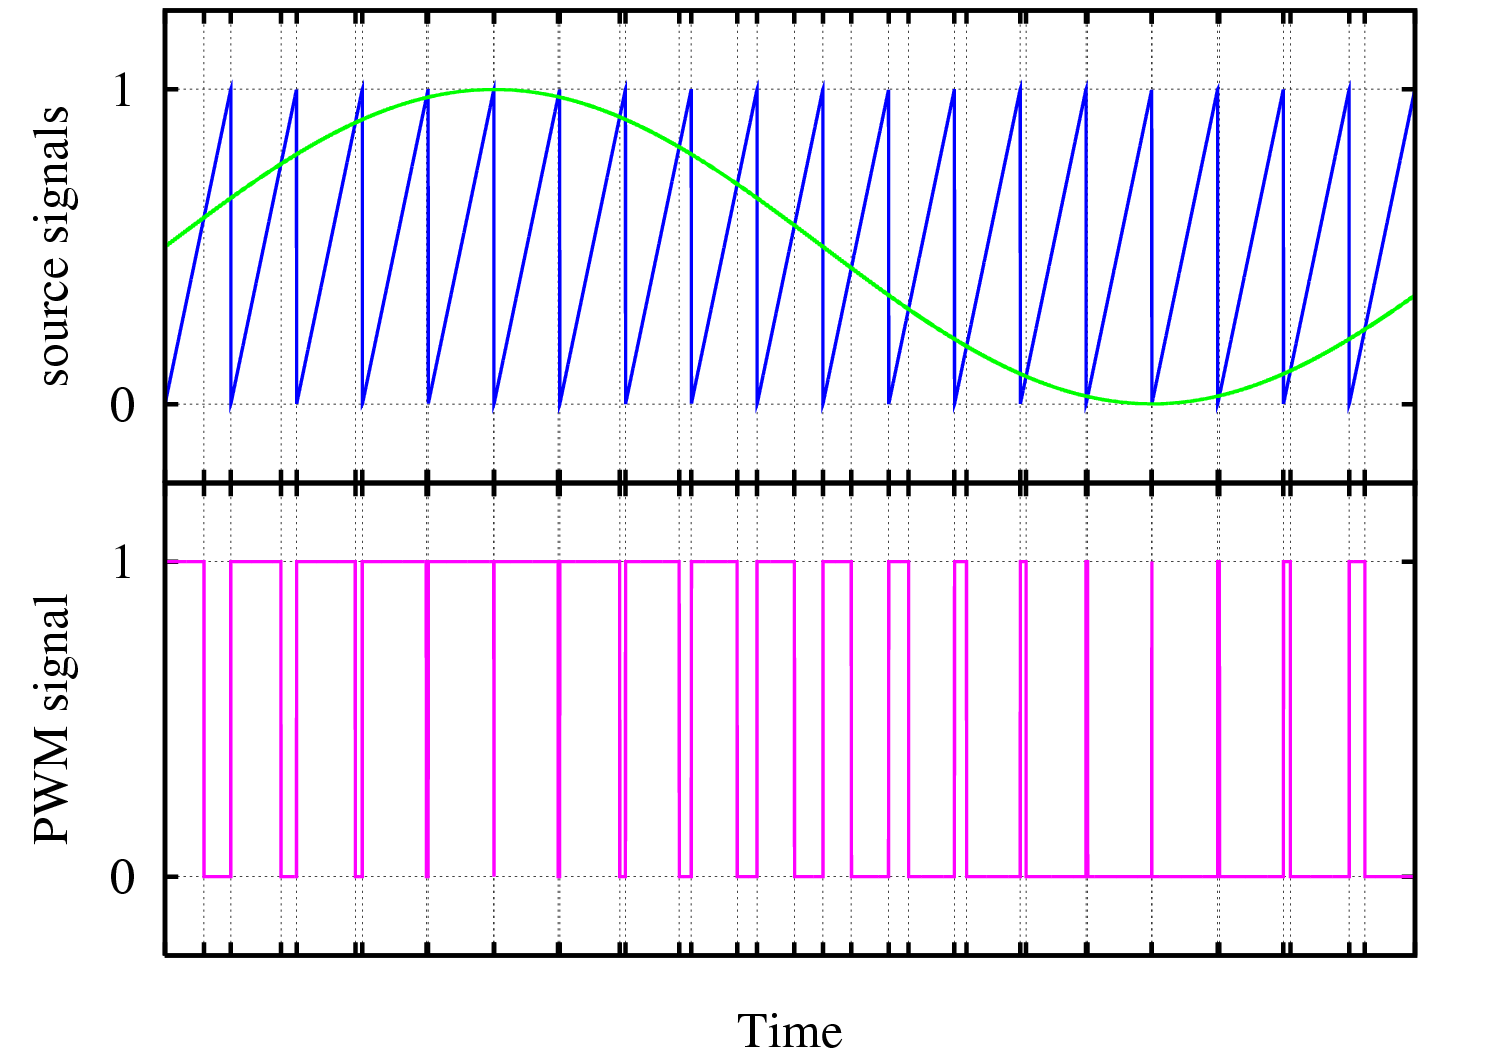
Principle of the intersective pulse width modulation (PWM).
This plot was created with Gnuplot.
The list of points used to define the tics along the x axis has been generated by the following python code:
#!/usr/bin/python

#this file generates a list of points used as ticks
# to draw the grid in the gnuplot file pwm.plt
from scipy import *

freq= 0.05

n=20
for i in range(n):
    def f(x):
        return sin(freq*x*2*pi)-2*x+1+2*i
    print i,",", optimize.fsolve(f,0), ",\"
}}
convert -density 300 pwm.eps pwm.png
The codes described above are given to the public domain.
Licensing
I, the copyright holder of this work, hereby publish it under the following licenses:

|
Permission is granted to copy, distribute and/or modify this document under the terms of the GNU Free Documentation License, Version 1.2 or any later version published by the Free Software Foundation; with no Invariant Sections, no Front-Cover Texts, and no Back-Cover Texts. A copy of the license is included in the section entitled GNU Free Documentation License. |
| This file is licensed under the Creative Commons Attribution-Share Alike 3.0 Unported license. | ||
| ||
| This licensing tag was added to this file as part of the GFDL licensing update. |
This file is licensed under the Creative Commons Attribution-Share Alike 2.5 Generic, 2.0 Generic and 1.0 Generic license.
- You are free:
- to share – to copy, distribute and transmit the work
- to remix – to adapt the work
- Under the following conditions:
- attribution – You must give appropriate credit, provide a link to the license, and indicate if changes were made. You may do so in any reasonable manner, but not in any way that suggests the licensor endorses you or your use.
- share alike – If you remix, transform, or build upon the material, you must distribute your contributions under the same or compatible license as the original.
You may select the license of your choice.
derivative works
Derivative works of this file: Pwm.svg