File:US Wealth Inequality - V2.png
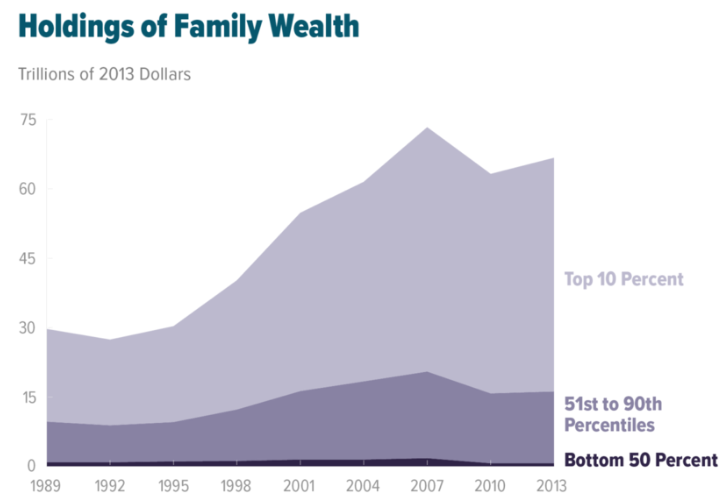
CBO Chart, U.S. Holdings of Family Wealth 1989 to 2013. The top 10% of families held 76% of the wealth in 2013, while the bottom 50% of families held 1%. Inequality worsened from 1989 to 2013.
References
- ↑ (August 18, 2016). "Trends in Family Wealth, 1989 to 2013". Congressional Budget Office. Retrieved on November 29, 2016.
Summary
| Description |
English: U.S. Holdings of Family Wealth 1989 to 2013 |
| Date | |
| Source | Congressional Budget Office Trends in Family Wealth, 1989 to 2013 |
| Author | Congressional Budget Office |
Licensing
This work is in the public domain in the United States because it is a work prepared by an officer or employee of the United States Government as part of that person’s official duties under the terms of Title 17, Chapter 1, Section 105 of the US Code.
Note: This only applies to original works of the Federal Government and not to the work of any individual U.S. state, territory, commonwealth, county, municipality, or any other subdivision. This template also does not apply to postage stamp designs published by the United States Postal Service since 1978. (See § 313.6(C)(1) of Compendium of U.S. Copyright Office Practices). It also does not apply to certain US coins; see The US Mint Terms of Use.
|
 | |
| This file has been identified as being free of known restrictions under copyright law, including all related and neighboring rights. | ||