File:US And USSR Nuclear Stockpiles.svg
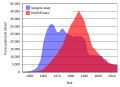
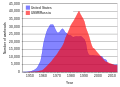
The high for the USA is 32,040 in 1967; the high for the USSR is 45,000 in 1986; the point at which the USSR surpassed the USA in warheads is 1978. Note that raw stockpile totals do not necessarily tell you much about nuclear capabilities; delivery mechanisms and types of weapons can make a big difference (many of the weapons added to the stockpile during the "surge" periods were tactical, not strategic, for example)
The goal of this graph is to give a quick, at-a-glance impression of relative stockpile levels between the two countries; those looking for specifics should consult the raw data (compiled on the discussion page of this image).
Own work
Source data from: Robert S. Norris and Hans M. Kristensen, "Global nuclear stockpiles, 1945-2006," Bulletin of the Atomic Scientists 62, no. 4 (July/August 2006), 64-66. Online at http://thebulletin.metapress.com/content/c4120650912x74k7/fulltext.pdf(Reusing this file)
- multilang-version
-
 af (Afrikaans)
 -
 ast (Asturian)
 -
 ms (Malay)
 -
 bs (Bosnian)
 -
 ca (Catalan)
 -
 cs (Czech)
 -
 cy (Welsh)
 -
 da (Danish)
 -
 de (German)
 -
 en (English)
 -
 es (Spanish)
 -
 fr (French)
 -
 ga (Irish)
 -
 gl (Galician)
 -
 it (Italian)
 -
 nl (Dutch)
 -
 no (Norwegian)
 -
 pl (Polish)
 -
 pt (Portuguese)
 -
 sl (Slovenian)
 -
 fi (Finnish)
 -
 sv (Swedish)
 -
 vi (Vietnamese)
 -
 tr (Turkish)
 -
 el (Greek)
 -
 bg (Bulgarian)
 -
 ru (Russian)
 -
 uk (Ukrainian)
 -
 hi (Hindi)
 -
 ko (Korean)
 -
 ja (Japanese)
 -
 zh (Chinese)
 -
 he (Hebrew)
 -
 ur (Urdu)
 -
 ar (Arabic)


- monolang-versions
-
 English - PNG
 -
 français
 -
 italiano


This vector image was created with an unknown SVG tool.
This file is translated using SVG
switch elements: all translations are stored in the same file.


