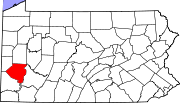
Haysville (PA)
Geography
Haysville is located at 40°31′32″N 80°9′32″W / 40.52556°N 80.15889°W (40.525534, −80.158945).
According to the United States Census Bureau, the borough has a total area of 0.3 square miles (0.78 km), of which 0.2 square miles (0.52 km) is land and 0.1 square miles (0.26 km), or 23.08%, is water.
Surrounding and adjacent neighborhoods
Haysville has three land borders with Aleppo Township to the north, Glenfield to the east and Glen Osborne to the west. Across the Ohio River to the south, Haysville runs adjacent with Coraopolis and Neville Township.
Education
Haysville is served by the Quaker Valley School District.
Government and politics
| Year | Republican | Democratic | Third parties |
|---|---|---|---|
| 2020 | 44% 25 | 51% 29 | 3% 2 |
| 2016 | 58% 23 | 38% 15 | 4% 2 |
| 2012 | 62% 24 | 38% 15 | 0% 0 |
Demographics
| Census | Pop. | Note | %± |
|---|---|---|---|
| 1910 | 166 | — | |
| 1920 | 173 | 4.2% | |
| 1930 | 192 | 11.0% | |
| 1940 | 169 | −12.0% | |
| 1950 | 177 | 4.7% | |
| 1960 | 143 | −19.2% | |
| 1970 | 154 | 7.7% | |
| 1980 | 117 | −24.0% | |
| 1990 | 100 | −14.5% | |
| 2000 | 78 | −22.0% | |
| 2010 | 70 | −10.3% | |
| 2020 | 81 | 15.7% | |
| Sources: | |||
As of the 2000 census, there were 78 people, 36 households, and 21 families residing in the borough. The population density was 389.0 inhabitants per square mile (150.2/km). There were 38 housing units at an average density of 189.5 per square mile (73.2/km). The racial makeup of the borough was 97.44% White, and 2.56% from two or more races.
There were 36 households, out of which 22.2% had children under the age of 18 living with them, 41.7% were married couples living together, 13.9% had a female householder with no husband present, and 38.9% were non-families. 27.8% of all households were made up of individuals, and 13.9% had someone living alone who was 65 years of age or older. The average household size was 2.17 and the average family size was 2.68.
In the borough the population was spread out, with 15.4% under the age of 18, 9.0% from 18 to 24, 30.8% from 25 to 44, 23.1% from 45 to 64, and 21.8% who were 65 years of age or older. The median age was 42 years. For every 100 females, there were 95.0 males. For every 100 females age 18 and over, there were 78.4 males.
The median income for a household in the borough was $33,750, and the median income for a family was $49,375. Males had a median income of $29,167 versus $21,250 for females. The per capita income for the borough was $53,151. There were 9.5% of families and 17.3% of the population living below the poverty line, including 23.1% of under eighteens and 12.5% of those over 64.
See also
References
- ^ "ArcGIS REST Services Directory". United States Census Bureau. Retrieved October 12, 2022.
- ^ "Census Population API". United States Census Bureau. Retrieved October 12, 2022.
- ^ "Explore Census Data".
- ^ Houser, Mark (January 28, 2001). "The cost of local government: 'Fragmentation' epitomized: Experts differ on efficiency of tiny towns". Pittsburgh Tribune-Review. Retrieved August 6, 2010.
- ^ "US Gazetteer files: 2010, 2000, and 1990". United States Census Bureau. February 12, 2011. Retrieved April 23, 2011.
- ^ EL. "2012 Allegheny County election". Pittsburgh Tribune-Review. Retrieved October 15, 2017.
- ^ EL. "2016 Pennsylvania general election..." Pittsburgh Post-Gazette. Retrieved October 15, 2017.
- ^ "Election Night Reporting".
- ^ "Number and Distribution of Inhabitants:Pennsylvania-Tennessee" (PDF). Fifteenth Census. U.S. Census Bureau.
- ^ "Number of Inhabitants: Pennsylvania" (PDF). 18th Census of the United States. U.S. Census Bureau. Retrieved November 22, 2013.
- ^ "Pennsylvania: Population and Housing Unit Counts" (PDF). U.S. Census Bureau. Retrieved November 22, 2013.
- ^ "U.S. Census website". United States Census Bureau. Retrieved January 31, 2008.
- ^ "Annual Estimates of the Resident Population". U.S. Census Bureau. Archived from the original on October 19, 2013. Retrieved November 22, 2013.
