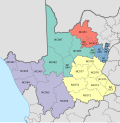
John Taola Gaetsewe District Municipality
The John Taolo Gaetsewe District Municipality (Tswana: Mmasepala wa Sedika wa John Taolo Gaetsewe; Afrikaans: John Taolo Gaetsewe-distriksmunisipaliteit), formerly the Kgalagadi District Municipality, is one of the five districts of the Northern Cape province of South Africa. The seat of the authority is Kuruman. As of 2011, the majority of its 176,899 residents speak Setswana. The district code is DC45.
Geography
Neighbours
John Taolo Gaetsewe is surrounded by:
- Dr Ruth Segomotsi Mompati (DC39) to the north-east
- Frances Baard (DC9) to the south
- ZF Mgcawu (DC8) to the south-west
- the Republic of Botswana in the north-west
Local municipalities
The district contains the following local municipalities:
| Local municipality | Population | % | Dominant language |
|---|---|---|---|
| Joe Morolong (formerly Moshaweng) | 84 099 | 47.54% | Tswana |
| Ga-Segonyana | 70 390 | 39.79% | Tswana |
| Gamagara | 16 175 | 9.14% | Afrikaans |
| Kalahari | 6 231 | 3.52% |
Demographics
The following statistics are from the 2001 census.
| Language | Population | % |
|---|---|---|
| Setswana | 151 654 | 85.73% |
| Afrikaans | 20 401 | 11.53% |
| IsiXhosa | 1 575 | 0.89% |
| Sesotho | 737 | 0.42% |
| English | 735 | 0.42% |
| Other | 447 | 0.25% |
| Sepedi | 429 | 0.24% |
| IsiZulu | 353 | 0.20% |
| SiSwati | 183 | 0.10% |
| IsiNdebele | 167 | 0.09% |
| Xitsonga | 151 | 0.09% |
| Tshivenda | 63 | 0.04% |
Gender
| Gender | Population | % |
|---|---|---|
| Female | 92 689 | 52.40% |
| Male | 84 210 | 47.60% |
Ethnic group
| Ethnic group | Population | % |
|---|---|---|
| Black African | 157 091 | 88.80% |
| Coloured | 10 358 | 5.86% |
| White | 9 352 | 5.29% |
| Indian/Asian | 98 | 0.06% |
Age
| Age | Population | % |
|---|---|---|
| 000 - 004 | 20 967 | 11.85% |
| 005 - 009 | 22 647 | 12.80% |
| 010 - 014 | 23 651 | 13.37% |
| 015 - 019 | 20 824 | 11.77% |
| 020 - 024 | 15 475 | 8.75% |
| 025 - 029 | 12 234 | 6.92% |
| 030 - 034 | 10 885 | 6.15% |
| 035 - 039 | 10 267 | 5.80% |
| 040 - 044 | 9 643 | 5.45% |
| 045 - 049 | 7 655 | 4.33% |
| 050 - 054 | 5 883 | 3.33% |
| 055 - 059 | 4 649 | 2.63% |
| 060 - 064 | 3 726 | 2.11% |
| 065 - 069 | 3 133 | 1.77% |
| 070 - 074 | 2 235 | 1.26% |
| 075 - 079 | 1 431 | 0.81% |
| 080 - 084 | 964 | 0.54% |
| 085 - 089 | 379 | 0.21% |
| 090 - 094 | 165 | 0.09% |
| 095 - 099 | 63 | 0.04% |
| 100 plus | 23 | 0.01% |
Politics
Election results
Election results for the district (under its former name, Kgalagadi) in the South African general election, 2004.
- Population 18 and over: 96 783 [54.71% of total population]
- Total votes: 65 198 [36.86% of total population]
- Voting % estimate: 67.37% votes as a % of population 18 and over
| Party | Votes | % |
|---|---|---|
| African National Congress | 51 456 | 78.92% |
| United Christian Democratic Party | 6 763 | 10.37% |
| Democratic Alliance | 2 687 | 4.12% |
| Independent Democrats | 1 084 | 1.66% |
| African Christian Democratic Party | 790 | 1.21% |
| New National Party | 690 | 1.06% |
| Freedom Front Plus | 585 | 0.90% |
| Pan African Congress | 267 | 0.41% |
| Azanian People's Organisation | 212 | 0.33% |
| United Democratic Movement | 161 | 0.25% |
| Inkhata Freedom Party | 97 | 0.15% |
| EMSA | 81 | 0.12% |
| NA | 57 | 0.09% |
| CDP | 57 | 0.09% |
| SOPA | 54 | 0.08% |
| PJC | 40 | 0.06% |
| TOP | 36 | 0.06% |
| UF | 35 | 0.05% |
| NLP | 17 | 0.03% |
| Minority Front | 15 | 0.02% |
| KISS | 14 | 0.02% |
| Total | 65 198 | 100.00% |
References
- ^ "Contact list: Executive Mayors". Government Communication & Information System. Archived from the original on 14 July 2010. Retrieved 22 February 2012.
- ^ "Statistics by place". Statistics South Africa. Retrieved 27 September 2015.
- ^ "Statistics by place". Statistics South Africa. Retrieved 27 September 2015.
