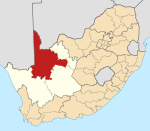
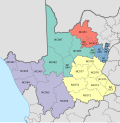
Mier Local Municipality
According to the 2011 census Mier has a population of 7,003, which is the smallest of any municipality in South Africa. It is also the most sparsely populated municipality in the country, covering a land area of 22,468 square kilometres (8,675 sq mi) with a population density of 0.31 inhabitants per square kilometre (0.80/sq mi). Mier is the municipality in South Africa with the highest percentage of Afrikaans speakers at 97.1%.
The name Mier is an Afrikaans word that originates from the word "mere" which means "lakes". When German missionaries visited the area a long time ago, they found the pans in the area full of water. They called them "mere". As language changed, the people later pronounced it as "mier".
After municipal elections on 3 August 2016 it was merged with the //Khara Hais Local Municipality to form the Dawid Kruiper Local Municipality.
Main places
The 2011 census divided the municipality into the following main places:
| Place | Code | Area (km) | Population |
|---|---|---|---|
| Askham | 377008 | 3.1 | 0 |
| Kalahari Gemsbok National Park | 377001 | 9,597.7 | 354 |
| Klein Mier | 377005 | 1.0 | 449 |
| Loubos | 377004 | 1.5 | 641 |
| Philandersbron | 377007 | 1.3 | 1,081 |
| Rietfontein | 377006 | 1.8 | 2,293 |
| Welkom | 377003 | 0.5 | 381 |
| Remainder | 377002 | 12,861.5 | 1,803 |
| Total | 7,003 | Afrikaans | |
Other villages and populated places in the municipality include Bokspits, Brsdring, Andriesvale and Tweerivieren.
Politics
The municipal council consisted of seven members elected by mixed-member proportional representation. Four councillors were elected by first-past-the-post voting in four wards, while the remaining three were chosen from party lists so that the total number of party representatives was proportional to the number of votes received. In the election of 18 May 2011 the African National Congress (ANC) won a majority of four seats on the council. The following table shows the results of the election.
| Party | Votes | Seats | ||||||
|---|---|---|---|---|---|---|---|---|
| Ward | List | Total | % | Ward | List | Total | ||
| ANC | 1,977 | 1,921 | 3,898 | 52.0 | 3 | 1 | 4 | |
| DA | 1,154 | 1,128 | 2,282 | 30.4 | 1 | 1 | 2 | |
| COPE | 636 | 687 | 1,323 | 17.6 | 0 | 1 | 1 | |
| Total | 3,767 | 3,736 | 7,503 | 100.0 | 4 | 3 | 7 | |
| Spoilt votes | 40 | 61 | 101 | |||||
References
- ^ "Contact list: Executive Mayors". Government Communication & Information System. Archived from the original on 14 July 2010. Retrieved 22 February 2012.
- ^ "Statistics by place". Statistics South Africa. Retrieved 27 September 2015.
- ^ South African Languages - Place names
- ^ "Mier Local Municipality". Census 2011.
- ^ "Results Summary – All Ballots: Mier" (PDF). Independent Electoral Commission. Retrieved 24 November 2013.
- ^ "Seat Calculation Detail: Mier" (PDF). Independent Electoral Commission. Retrieved 24 November 2013.
External links

