OH-5
Ohio's 5th congressional district is in northwestern and north central Ohio and borders Indiana. The district is currently represented by Republican Bob Latta.

Recent election results from statewide races
| Year | Office | Results |
|---|---|---|
| 2008 | President | McCain 50% - 48% |
| 2012 | President | Romney 54% - 46% |
| 2016 | President | Trump 60% - 35% |
| Senate | Portman 64% - 30% | |
| 2018 | Senate | Renacci 52% - 48% |
| Governor | DeWine 58% - 39% | |
| Attorney General | Yost 60% - 40% | |
| 2020 | President | Trump 63% - 36% |
| 2022 | Senate | Vance 61% - 39% |
| Governor | DeWine 71% - 29% | |
| Secretary of State | LaRose 68% - 31% | |
| Treasurer | Sprague 68% - 32% | |
| Auditor | Faber 68% - 32% | |
| Attorney General | Yost 69% - 31% | |
| 2024 | President | Trump 64% - 35% |
| Senate | Moreno 58% - 38% |
Composition
| # | County | Seat | Population |
|---|---|---|---|
| 33 | Crawford | Bucyrus | 41,529 |
| 63 | Hancock | Findlay | 74,704 |
| 69 | Henry | Napoleon | 27,520 |
| 77 | Huron | Norwalk | 58,199 |
| 93 | Lorain | Elyria | 317,910 |
| 107 | Mercer | Celina | 42,439 |
| 125 | Paulding | Paulding | 18,706 |
| 137 | Putnam | Ottawa | 34,199 |
| 147 | Seneca | Tiffin | 54,527 |
| 161 | Van Wert | Van Wert | 28,704 |
| 173 | Wood | Bowling Green | 132,650 |
| 175 | Wyandot | Upper Sandusky | 21,457 |
Cities and CDPs with 10,000 or more people
- Lorain – 65,211
- Elyria – 53,117
- Findlay – 40,139
- North Ridgeville – 35,280
- Bowling Green – 30,384
- Avon Lake – 25,942
- Avon – 25,403
- Tiffin – 17,953
- Norwalk – 17,068
- Fostoria – 13,039
- Amherst – 12,928
- Celina – 10,885
- Bucyrus – 11,542
- Van Wert – 11,092
- Vermillion – 10,659
- Galion – 10,293
2,500 – 10,000 people
- Sheffield Lake – 8,957
- Napoleon – 8,862
- Oberlin – 8,555
- Bellevue – 8,164
- Delphos – 7,061
- Upper Sandusky – 6,698
- Willard – 6,197
- Grafton – 5,773
- Wellington – 4,799
- Coldwater – 4,712
- Crestline – 4,460
- Ottawa – 4,456
- Sheffield – 4,135
- Bluffton – 3,903
- Paulding – 3,555
- Carey – 3,491
- North Baltimore – 3,369
- St. Henry – 2,596
- LaGrange – 2,595
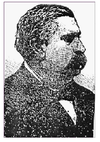
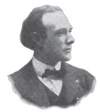
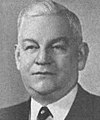
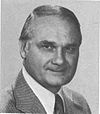
List of members representing the district
Election results
The following chart shows historic election results. Bold type indicates victor. Italic type indicates incumbent.
| Year | Democratic | Republican | Other |
|---|---|---|---|
| 1812 | District created following the 1810 census. | ||
| ... | |||
| 1920 | Newt Bronson: 25,395 | Charles J. Thompson: 40,381 | |
| 1922 | Frank C. Kniffin: 28,067 | Charles J. Thompson: 31,700 | |
| 1924 | Frank C. Kniffin: 29,245 | Charles J. Thompson: 31,045 | |
| 1926 | Frank C. Kniffin: 23,022 | Charles J. Thompson: 23,638 | |
| 1928 | Frank C. Kniffin: 31,385 | Charles J. Thompson: 36,096 | |
| 1930 | Frank C. Kniffin: 29,117 | Charles J. Thompson: 27,497 | |
| 1932 | Frank C. Kniffin: 44,433 | William L. Manahan: 29,605 | |
| 1934 | Frank C. Kniffin: 34,249 | Davis B. Johnson: 27,423 | |
| 1936 | Frank C. Kniffin: 41,693 | Stephan S. Beard: 33,212 | Fred L. Hay: 3,663 |
| 1938 | Frank C. Kniffin: 28,109 | Cliff Clevenger: 37,027 | |
| 1940 | C. H. Armbruster: 31,063 | Cliff Clevenger: 48,040 | |
| 1942 | Ferdinand E. Warren: 17,514 | Cliff Clevenger: 30,667 | |
| 1944 | T. Walter Williams: 22,740 | Cliff Clevenger: 48,490 | |
| 1946 | Willard Thomas: 20,163 | Cliff Clevenger: 30,623 | |
| 1948 | Dan Batt: 32,076 | Cliff Clevenger: 34,950 | |
| 1950 | Dan Batt: 26,689 | Cliff Clevenger: 36,096 | |
| 1952 | Dan Batt: 42,104 | Cliff Clevenger: 72,168 | |
| 1954 | Martin W. Feigert: 33,483 | Cliff Clevenger: 49,265 | |
| 1956 | George E. Rafferty: 42,181 | Cliff Clevenger: 69,774 | |
| 1958 | George E. Rafferty: 44,971 | Delbert L. Latta: 52,612 | |
| 1960 | Tom T. McRitchie: 41,375 | Delbert L. Latta: 85,175 | |
| 1962 | William T. Hunt: 29,114 | Delbert L. Latta: 69,272 | |
| 1964 | Milford Landis: 41,621 | Delbert L. Latta: 80,394 | |
| 1966 | John H. Shock: 26,503 | Delbert L. Latta: 80,906 | |
| 1968 | Louis Richard Batzler: 45,884 | Delbert L. Latta: 113,381 | |
| 1970 | Carl G. Sherer: 37,545 | Delbert L. Latta: 92,577 | |
| 1972 | Bruce Edwards: 49,465 | Delbert L. Latta: 132,032 | |
| 1974 | Bruce Edwards: 53,391 | Delbert L. Latta: 89,161 | |
| 1976 | Bruce Edwards: 60,304 | Delbert L. Latta: 124,910 | |
| 1978 | James R. Sherck: 51,071 | Delbert L. Latta: 85,547 | |
| 1980 | James R. Sherck: 57,704 | Delbert L. Latta: 137,003 | |
| 1982 | James R. Sherck: 70,120 | Delbert L. Latta: 86,450 | |
| 1984 | James R. Sherck: 78,809 | Delbert L. Latta: 132,582 | |
| 1986 | Tom Murray: 54,864 | Delbert L. Latta: 102,016 | |
| 1988 | Tom Murray: 80,472 | Paul E. Gillmor: 128,838 | |
| 1990 | P. Scott Mange: 41,693 | Paul E. Gillmor: 113,615 | John E. Jackson: 10,612 |
| 1992 | Paul E. Gillmor: 187,860 | ||
| 1994 | Jarrod Tudor: 49,335 | Paul E. Gillmor: 135,879 | |
| 1996 | Annie Saunders: 81,170 | Paul E. Gillmor: 145,892 | David J. Schaffer (N): 11,461 |
| 1998 | Susan Davenport Darrow: 61,926 | Paul E. Gillmor: 123,979 | |
| 2000 | Dannie Edmon: 62,138 | Paul E. Gillmor: 169,857 | John F. Green (L): 5,464 David J. Schaffer (N): 5,881 |
| 2002 | Roger Anderson: 51,872 | Paul E. Gillmor: 126,286 | John F. Green: 10,096 |
| 2004 | Robin Weirauch: 95,481 | Paul E. Gillmor: 194,559 | |
| 2006 | Robin Weirauch: 95,955 | Paul E. Gillmor : 126,898 | |
| 2007* | Robin Weirauch: 32,246 | Robert E. Latta: 41,740 | |
| 2008 | George Mays: 105,840 | Robert E. Latta: 188,905 | |
| 2012 | Angela Zimmann: 137,806 | Robert E. Latta: 201,514 | Eric Eberly (L) : 12,558 |
| 2014 | Robert Fry: 57,328 | Robert E. Latta: 132,448 | Eric Eberly (L) : 9,142 |
| 2016 | James L. Neu Jr.: 100,392 | Robert E. Latta: 244,599 | |
| 2018 | J. Michael Galbraith: 99,655 | Robert E. Latta: 176,569 | Don Kissick (L): 7,393 |
| 2020 | Nick Rubando: 120,962 | Robert E. Latta: 257,019 | |
| 2022 | Craig Swartz: 92,634 | Robert E. Latta: 187,303 | |
2010
| Party | Candidate | Votes | % | |
|---|---|---|---|---|
| Republican | Bob Latta* | 140,703 | 67.82 | |
| Democratic | Caleb Finkenbiner | 54,919 | 26.47 | |
| Libertarian | Brian Smith | 11,831 | 5.70 | |
| Total votes | 207,453 | 100.00 | ||
| Turnout | ||||
| Republican hold | ||||
2012
| Party | Candidate | Votes | % | |
|---|---|---|---|---|
| Republican | Bob Latta (incumbent) | 201,514 | 57.3 | |
| Democratic | Angela Zimmann | 137,806 | 39.2 | |
| Libertarian | Eric Eberly | 12,558 | 3.5 | |
| Total votes | 351,878 | 100.0 | ||
| Republican hold | ||||
2014
| Party | Candidate | Votes | % | |
|---|---|---|---|---|
| Republican | Bob Latta (incumbent) | 134,449 | 66.5 | |
| Democratic | Robert Fry | 58,507 | 28.9 | |
| Libertarian | Eric Eberly | 9,344 | 4.6 | |
| Total votes | 202,300 | 100.0 | ||
| Republican hold | ||||
2016
| Party | Candidate | Votes | % | |
|---|---|---|---|---|
| Republican | Bob Latta (incumbent) | 244,599 | 70.9 | |
| Democratic | James L. Neu Jr. | 100,392 | 29.1 | |
| Total votes | 344,991 | 100.0 | ||
| Republican hold | ||||
2018
| Party | Candidate | Votes | % | ||
|---|---|---|---|---|---|
| Republican | Bob Latta (incumbent) | 176,569 | 62.3 | ||
| Democratic | J. Michael Galbraith | 99,655 | 35.1 | ||
| Libertarian | Don Kissick | 7,393 | 2.6 | ||
| Total votes | 283,617 | 100.0 | |||
| Republican hold | |||||
2020
| Party | Candidate | Votes | % | |
|---|---|---|---|---|
| Republican | Bob Latta (incumbent) | 257,019 | 68.0 | |
| Democratic | Nick Rubando | 120,962 | 32.0 | |
| Total votes | 377,981 | 100.0 | ||
| Republican hold | ||||
2022
| Party | Candidate | Votes | % | ||
|---|---|---|---|---|---|
| Republican | Bob Latta (incumbent) | 187,303 | 66.9 | ||
| Democratic | Craig Swartz | 92,634 | 33.1 | ||
| Total votes | 279,937 | 100.0 | |||
| Republican hold | |||||
Historical district boundaries

2003–2013
See also
- Ohio's congressional districts
- List of United States congressional districts
- Ohio's 5th congressional district special election, 2007
References
- ^ Geography. "Congressional Districts Relationship Files (state-based) Bureau". www.census.gov. Retrieved April 9, 2018.
- ^ "My Congressional District". US Census. Retrieved September 22, 2024.
- ^ "2022 Cook PVI: District Map and List". Cook Political Report. July 12, 2022. Retrieved January 10, 2023.
- ^ https://davesredistricting.org/maps#viewmap::64d56870-70ea-4f4d-b667-9a4fd60ac511
- ^ https://opoliticsguru.github.io/2024-Presidential-Election-Results-Ohio/#6/42.253/-77.783
- ^ "2024 U.S. Senate Election in Ohio: Official Results".
- ^ Federal Elections 2008. Federal Elections Commission, Washington DC, July 2009
- ^ "2012 Election Results". Ohio Secretary of State. Archived from the original on July 30, 2013. Retrieved July 31, 2013.
- ^ "2014 Election Results". Ohio Secretary of State.
- Martis, Kenneth C. (1989). The Historical Atlas of Political Parties in the United States Congress. New York: Macmillan Publishing Company.
- Martis, Kenneth C. (1982). The Historical Atlas of United States Congressional Districts. New York: Macmillan Publishing Company.
- Congressional Biographical Directory of the United States 1774–present
