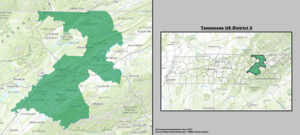
Tennessee's 2nd Congressional District
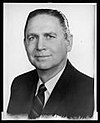
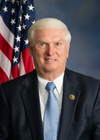
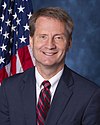
In the 1964 election, the district chose Knoxville mayor John Duncan, Sr. Duncan served for 23 years before he died in the summer of 1988. Following Duncan's death, the district elected his son, Jimmy. The younger Duncan served for over thirty years from late 1988 until his successor was sworn in early January 2019. Upon Jimmy Duncan's retirement, the district chose outgoing Knox County mayor Tim Burchett, who has served since January 2019.
The few Democratic pockets in the district are located in Knoxville, which has elected Democratic mayors consecutively since 2011, and sends Democratic legislators to the Tennessee General Assembly. However, they are no match for the overwhelming Republican bent of the rest of Knox County and the more suburban and rural areas. For example, Blount, Jefferson, and Grainger Counties are among the few counties in the country to have never supported a Democrat for president since the Civil War.
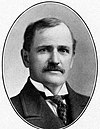
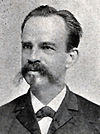
This district traditionally gives its members of Congress very long tenures in Washington, electing some of the few truly senior Southern Republican members before the 1950s. Since 1909, only seven people (not counting caretakers) have represented the district – Richard W. Austin, J. Will Taylor, John Jennings Jr., Howard Baker Sr., John Duncan Sr., Jimmy Duncan, and Burchett. All six of Burchett's predecessors have served at least ten years in Congress, with Taylor and the Duncans holding the seat for at least twenty years.
Current boundaries
The district is located in East Tennessee and borders Kentucky and Virginia to the north and North Carolina to the south.
It covers all of Blount, Claiborne, Grainger, Knox, Loudon and Union counties, along with the northern half of Campbell County and a sliver of Jefferson County.
History
The district is based in Knoxville and is largely coextensive with that city's metropolitan area. The area is known for being the home of the flagship campus for the University of Tennessee, hosting the 1982 World's Fair, and for being the headquarters for the Tennessee Valley Authority, Ruby Tuesday, and Pilot Flying J.
The 2nd is similar in character to the neighboring 1st. It has long been one of the safest districts in the nation for the Republican Party. No Democrat has represented the district since 1855, and Republicans have held the district continuously since 1867 — the longest time any party has retained any district. The Democrats waged some competitive races in the district during the 1930s. However, they have not put up a substantive candidate since 1964 and have only managed 40 percent of the vote twice since then.
Most of its residents supported the United States over the Confederacy during the American Civil War; it was one of four districts whose members of Congress did not resign when Tennessee declared secession from the United States in 1861. The area's residents immediately identified with the Republicans after hostilities ceased. Much of that sentiment was derived from the region's economic base of small-scale farming, with little or no use for slavery; thus, voters were mostly indifferent or hostile to the concerns of plantation owners and other landed interests farther west in the state, who aligned themselves with the Democratic Party. This loyalty has persisted through good times and bad ever since, despite the vast ideological changes in both political parties since that time.
Recent election results from statewide races
| Year | Office | Results |
|---|---|---|
| 2008 | President | McCain 64% - 34% |
| 2012 | President | Romney 69% - 31% |
| 2016 | President | Trump 65% - 30% |
| 2018 | Senate | Blackburn 57% - 42% |
| Governor | Lee 63% - 35% | |
| 2020 | President | Trump 64% - 34% |
| Senate | Hagerty 66% - 32% | |
| 2024 | President | Trump 66% - 32% |
List of members representing the district
Recent election results
2012
| Party | Candidate | Votes | % | ||
|---|---|---|---|---|---|
| Republican | John J. Duncan, Jr. (incumbent) | 196,894 | 74.4 | ||
| Democratic | Troy Goodale | 54,522 | 20.6 | ||
| Green | Norris Dryer | 5,733 | 2.2 | ||
| Libertarian | Greg Samples | 4,382 | 1.7 | ||
| Independent | Brandon Stewart | 2,974 | 1.1 | ||
| Total votes | 264,505 | 100 | |||
| Republican hold | |||||
2014
| Party | Candidate | Votes | % | |
|---|---|---|---|---|
| Republican | John J. Duncan, Jr. (incumbent) | 120,833 | 72.5 | |
| Democratic | Bob Scott | 37,612 | 22.6 | |
| Green | Norris Dryer | 4,033 | 2.4 | |
| Independent | Casey Adam Gouge | 4,223 | 2.5 | |
| Total votes | 166,701 | 100.0 | ||
| Republican hold | ||||
2016
| Party | Candidate | Votes | % | |
|---|---|---|---|---|
| Republican | John J. Duncan, Jr. (incumbent) | 212,455 | 75.6 | |
| Democratic | Stuart Starr | 68,401 | 24.4 | |
| Total votes | 280,856 | 100.0 | ||
| Republican hold | ||||
2018
| Party | Candidate | Votes | % | |
|---|---|---|---|---|
| Republican | Tim Burchett | 172,856 | 65.9 | |
| Democratic | Renee Hoyos | 86,668 | 33.1 | |
| Independent | Greg Samples | 967 | 0.4 | |
| Independent | Jeffrey Grunau | 657 | 0.3 | |
| Independent | Marc Whitmire | 637 | 0.2 | |
| Independent | Keith LaTorre | 349 | 0.1 | |
| Total votes | 262,134 | 100.0 | ||
| Republican hold | ||||
2020
| Party | Candidate | Votes | % | |
|---|---|---|---|---|
| Republican | Tim Burchett (incumbent) | 238,907 | 67.6 | |
| Democratic | Renee Hoyos | 109,684 | 31.1 | |
| Independent | Matthew Campbell | 4,592 | 1.3 | |
| Write-in | 14 | 0.0 | ||
| Total votes | 353,197 | 100.0 | ||
| Republican hold | ||||
2022
| Party | Candidate | Votes | % | |
|---|---|---|---|---|
| Republican | Tim Burchett (incumbent) | 141,089 | 67.9 | |
| Democratic | Mark Harmon | 66,673 | 32.0 | |
| Total votes | 207,762 | 100.0 | ||
| Republican hold | ||||
See also
Notes
- ^ Supported the Jackson faction in the 1824 United States presidential election
References
- ^ "Congressional Districts Relationship Files (State-based)". U.S. Census Bureau. Archived from the original on April 2, 2013.
- ^ Center for New Media & Promotion (CNMP), US Census Bureau. "My Congressional District". www.census.gov.
- ^ "2022 Cook PVI: District Map and List". Cook Political Report. July 12, 2022. Retrieved January 10, 2023.
- ^ https://davesredistricting.org/maps#viewmap::9185d1ce-1556-46ab-9628-6749769d0262
- ^ "2024 Tennessee Presidential election by congressional district". Dave's Redistricting. Retrieved January 14, 2025.
- ^ "November 4, 2014 General Election Results" (PDF). Secretary of State of Tennessee. December 3, 2014. Retrieved October 23, 2022.
- ^ "November 2016 US House Results by County" (PDF). Secretary of State of Tennessee. December 13, 2016. Retrieved October 23, 2022.
- ^ Johnson, Cheryl L. (February 28, 2019). "Statistics of the Congressional Election of November 6, 2018". Clerk of the U.S. House of Representatives. Retrieved April 27, 2019.
- ^ State of Tennessee General Election Results, November 3, 2020, Results By Office (PDF) (Report). Secretary of State of Tennessee. December 2, 2020. Retrieved December 2, 2020.
- Martis, Kenneth C. (1989). The Historical Atlas of Political Parties in the United States Congress. New York: Macmillan Publishing Company.
- Martis, Kenneth C. (1982). The Historical Atlas of United States Congressional Districts. New York: Macmillan Publishing Company.
- Congressional Biographical Directory of the United States 1774–present
