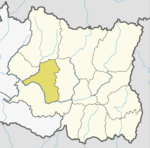
Aiselukharka
According to Ministry of Federal Affairs and Local Developme Aiselukharka has an area of 125.93 square kilometres (48.62 sq mi) and the total population of the municipality is 16097 as of Census of Nepal 2011.
Ainselu Kharka, Ribdung Jaleshwari, Jyamire, Bakachol, Ribdung Maheshwari, Magpa and Rakha Bangdel which previously were all separate Village development committee merged to form this new local level body. Fulfilling the requirement of the new Constitution of Nepal 2015, Ministry of Federal Affairs and Local Development replaced all old VDCs and Municipalities into 753 new local level body (Municipality).
The rural municipality is divided into total 7 wards and the headquarter of this newly formed rural municipality is situated in Ainselu Kharka.
Climate
| Climate data for Aiselukharka, elevation 2,143 m (7,031 ft) | |||||||||||||
|---|---|---|---|---|---|---|---|---|---|---|---|---|---|
| Month | Jan | Feb | Mar | Apr | May | Jun | Jul | Aug | Sep | Oct | Nov | Dec | Year |
| Mean daily maximum °C (°F) | 12.1 (53.8) |
13.8 (56.8) |
18.2 (64.8) |
19.3 (66.7) |
20.1 (68.2) |
20.8 (69.4) |
21.5 (70.7) |
21.7 (71.1) |
20.6 (69.1) |
19.5 (67.1) |
16.8 (62.2) |
13.8 (56.8) |
18.2 (64.7) |
| Daily mean °C (°F) | 6.0 (42.8) |
7.5 (45.5) |
11.5 (52.7) |
14.3 (57.7) |
15.6 (60.1) |
17.2 (63.0) |
18.0 (64.4) |
17.8 (64.0) |
16.7 (62.1) |
14.6 (58.3) |
10.6 (51.1) |
7.4 (45.3) |
13.1 (55.6) |
| Mean daily minimum °C (°F) | 0.0 (32.0) |
1.3 (34.3) |
4.9 (40.8) |
9.5 (49.1) |
11.3 (52.3) |
13.6 (56.5) |
14.6 (58.3) |
14.1 (57.4) |
13.1 (55.6) |
9.8 (49.6) |
4.3 (39.7) |
1.0 (33.8) |
8.1 (46.6) |
| Average precipitation mm (inches) | 18.4 (0.72) |
14.3 (0.56) |
32.1 (1.26) |
75.6 (2.98) |
190.1 (7.48) |
420.5 (16.56) |
592.8 (23.34) |
523.4 (20.61) |
312.5 (12.30) |
111.2 (4.38) |
15.7 (0.62) |
12.3 (0.48) |
2,318.9 (91.29) |
| Source: FAO JICA | |||||||||||||
References
- ^ "स्थानीय तहहरुको विवरण". www.mofald.gov.np/en. MoFALD. Archived from the original on 31 August 2018. Retrieved 17 April 2018.
- ^ "CITY POPULATION – statistics, maps & charts". www.citypopulation.de. 8 October 2017. Retrieved 17 April 2018.
- ^ "World-wide Agroclimatic Data of FAO (FAOCLIM)". Food and Agriculture Organization of United Nations. Retrieved 28 October 2024.
- ^ "ネパール国 全国貯水式水力発電所マスタープラン調査 ファイナルレポート" (PDF). Japan International Cooperation Agency. Archived from the original (PDF) on 6 April 2024. Retrieved 6 June 2024.
External links
