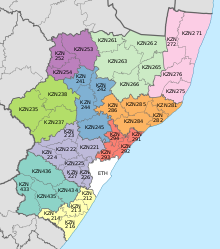
Ilembe District Municipality
iLembe is one of the 11 district municipalities of KwaZulu-Natal province in South Africa. The seat of iLembe is KwaDukuza. The majority (82%) of its 606,809 people speak isiZulu as their first language (2011 census). The district code is DC29. It was formerly named the King Shaka District Municipality.
Geography
Neighbours
iLembe is surrounded by:
- Umzinyathi to the north (DC24)
- the Indian Ocean to the east
- eThekwini to the south (Durban)
- Umgungundlovu to the west (DC22)
- King Cetshwayo District Municipality to the north-east (DC28)
- Umlalazi to the North-west
Local municipalities
The district contains the following local municipalities:
| Local municipality | Population | % |
|---|---|---|
| KwaDukuza | 231 187 | 38.10% |
| Ndwedwe | 140 820 | 23.21% |
| Mandeni | 138 078 | 22.75% |
| Maphumulo | 96 724 | 15.94% |
Demographics
The following statistics are from the 2011 census.
| Language | Population | % |
|---|---|---|
| Zulu | 496 834 | 82.18% |
| English | 58 227 | 9.63% |
| Xhosa | 20 005 | 3.31% |
| Ndebele | 7 145 | 1.18% |
| Afrikaans | 5 210 | 0.86% |
| Other | 4 465 | 0.74% |
| Sign language | 4 340 | 0.72% |
| Tswana | 3 156 | 0.52% |
| Tsonga | 1 916 | 0.32% |
| Sotho | 1 062 | 0.18% |
| Swati | 624 | 0.10% |
| Venda | 261 | 0.04% |
Gender
| Gender | Population | % |
|---|---|---|
| Female | 317 801 | 52.37% |
| Male | 289 009 | 47.63% |
Ethnic group
| Ethnic group | Population | % |
|---|---|---|
| Black African | 550 758 | 90.76% |
| Indian/Asian | 35 911 | 5.92% |
| White | 14 713 | 2.42% |
| Coloured | 3 222 | 0.53% |
| Other | 2 205 | 0.36% |
Age
| Age | Population | % |
|---|---|---|
| 000 - 004 | 63 172 | 11.27% |
| 005 - 009 | 70 472 | 12.58% |
| 010 - 014 | 71 672 | 12.79% |
| 015 - 019 | 68 769 | 12.27% |
| 020 - 024 | 51 863 | 9.25% |
| 025 - 029 | 44 409 | 7.92% |
| 030 - 034 | 34 767 | 6.20% |
| 035 - 039 | 32 311 | 5.77% |
| 040 - 044 | 26 364 | 4.70% |
| 045 - 049 | 21 287 | 3.80% |
| 050 - 054 | 19 708 | 3.52% |
| 055 - 059 | 14 517 | 2.59% |
| 060 - 064 | 13 614 | 2.43% |
| 065 - 069 | 9 802 | 1.75% |
| 070 - 074 | 8 611 | 1.54% |
| 075 - 079 | 4 533 | 0.81% |
| 080 - 084 | 2 909 | 0.52% |
| 085 - 089 | 876 | 0.16% |
| 090 - 094 | 420 | 0.07% |
| 095 - 099 | 248 | 0.04% |
| 100 plus | 85 | 0.02% |
Politics
Election results
Election results for iLembe in the South African general election, 2004.
- Population 18 and over: 312 758 [55.81% of total population]
- Total votes: 166 460 [29.70% of total population]
- Voting % estimate: 53.22% votes as a % of population 18 and over
| Party | Votes | % |
|---|---|---|
| African National Congress | 78 343 | 47.06% |
| Inkhata Freedom Party | 69 110 | 41.52% |
| Democratic Alliance | 10 311 | 6.19% |
| African Christian Democratic Party | 2 113 | 1.27% |
| United Democratic Movement | 1 214 | 0.73% |
| Minority Front | 727 | 0.44% |
| New National Party | 570 | 0.34% |
| Azanian People's Organisation | 567 | 0.34% |
| UF | 542 | 0.33% |
| Independent Democrats | 466 | 0.28% |
| Freedom Front Plus | 401 | 0.24% |
| United Christian Democratic Party | 331 | 0.20% |
| Pan African Congress | 316 | 0.19% |
| SOPA | 280 | 0.17% |
| CDP | 247 | 0.15% |
| EMSA | 228 | 0.14% |
| PJC | 209 | 0.13% |
| KISS | 150 | 0.09% |
| NA | 133 | 0.08% |
| TOP | 120 | 0.07% |
| NLP | 82 | 0.05% |
| Total | 166 460 | 100.00% |
See also
References
- ^ "Contact list: Executive Mayors". Government Communication & Information System. Archived from the original on 14 July 2010. Retrieved 22 February 2012.
- ^ "Statistics by place". Statistics South Africa. Retrieved 27 September 2015.
- ^ "ILembe District Municipality". Archived from the original on 2009-05-22. Retrieved 2009-10-08.
- ^ "Ilembe Case Study" (PDF). The Water Dialogues. p. 10. Archived from the original (PDF) on 2016-03-03. Retrieved 2013-03-16.
